Charts, Graphs, and Infographics: How Do These Help Us Interpret Data?

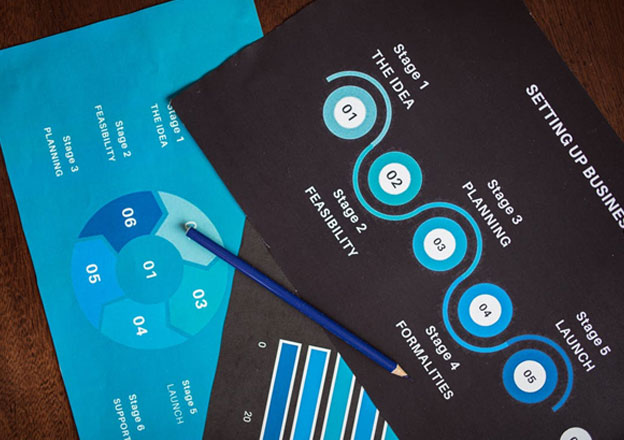
According to the Harvard Data Science Review, data visualization essentially translates raw data into a simple summary. Visual tools, like charts, graphs, and infographics, can help everyday people understand complex concepts and make extensive data more accessible to all.
Running an e-commerce business? Automate your entire online selling process with multichannel e-commerce software from eChannelHub. Try it for free today!
When Is Data Visualization Useful?
Data visualization is valuable in every area of our lives. During the height of the coronavirus pandemic, the NHS, CDC, and WHO all released information about the virus, its spread, and mortality statistics through visual graphics. This helped us make more informed decisions about how to proceed when lockdowns were over. Data visualization is a great way to spread facts quickly and give individuals control over their surroundings by arming them with the information they need.
Data Visualization And Business
While everyday individuals can use data visualization, it’s also extremely valuable for businesses. Two examples are in finances and marketing.
From a financial perspective, visual tools can help you spot trends in everything from customer payments to the types of inventory that sit in your warehouse collecting dust. You might, for example, transform multiple years’ AR aging reports (these essentially tell you how much money you’ve yet to collect) into a chart that can help you decide which types of invoices tend to go unpaid and by whom. Your data can also be visually showcased to employees and investors alike to ensure everyone has a greater understanding of how your operation works.
In marketing, data can help owners/managers personalize their marketing strategies to each demographic they serve. Visualizing data can also help you look out for risky areas and places within your business that you might streamline to create a better consumer experience. Regardless of how you use your data, it’s important that you have a way to change it as the data changes. One tip here is to find a PDF editor online so that you can alter your charts, drawings, and images directly from your computer. This tool will work in any browser and device.
Types Of Data Visualization Tools
Ultimately, any method that you use to convert complex data into an easy-to-read and understand medium is technically visualized data. However, many of the most common data visualization tools include pie charts, infographics, scatter charts, bar graphs, and Venn diagrams. Of these, pie charts are perhaps the best well known, and JMP Statistical Discovery explains that these simple diagrams help to show how one part contributes to a whole.
Data Visualization Tips
To get started with data visualization, there are a few basic tips to keep in mind. These include:
- Choose the right type of chart
- Don’t add information that’s not pertinent to the core message
- Clear visual clutter, such as drop shadows and unnecessary illustrations
- Strive for efficiency
- Keep comparisons close together
- Don’t over-explain – the point is to be succinct and to allow the reader to dive deeper if necessary
- Use one color for each type of data
- Use trustworthy and authoritative sources and provide a link to them
If the idea of data visualization intimidates you, don’t let it. While it might sound like something you need a degree to participate in, the truth is that starting out with data visualization doesn’t have to be difficult. Something as simple as creating a pie chart or comparison graphs to get a point across is just as effective as a more detailed infographic. What’s important is that your information is presented clearly (and can be edited as the facts change) and is given to the people that need it most.
Write For Us
Gain multichannel inventory visibility and control with eChannelHub
Learn more about eChannelHub with a free demo, tailored for your unique retail business.
Request A DemoRequest a Demo
Gain multichannel inventory visibility and control with eChannelHub
Learn more about eChannelHub with a free demo, tailored for your unique online business


